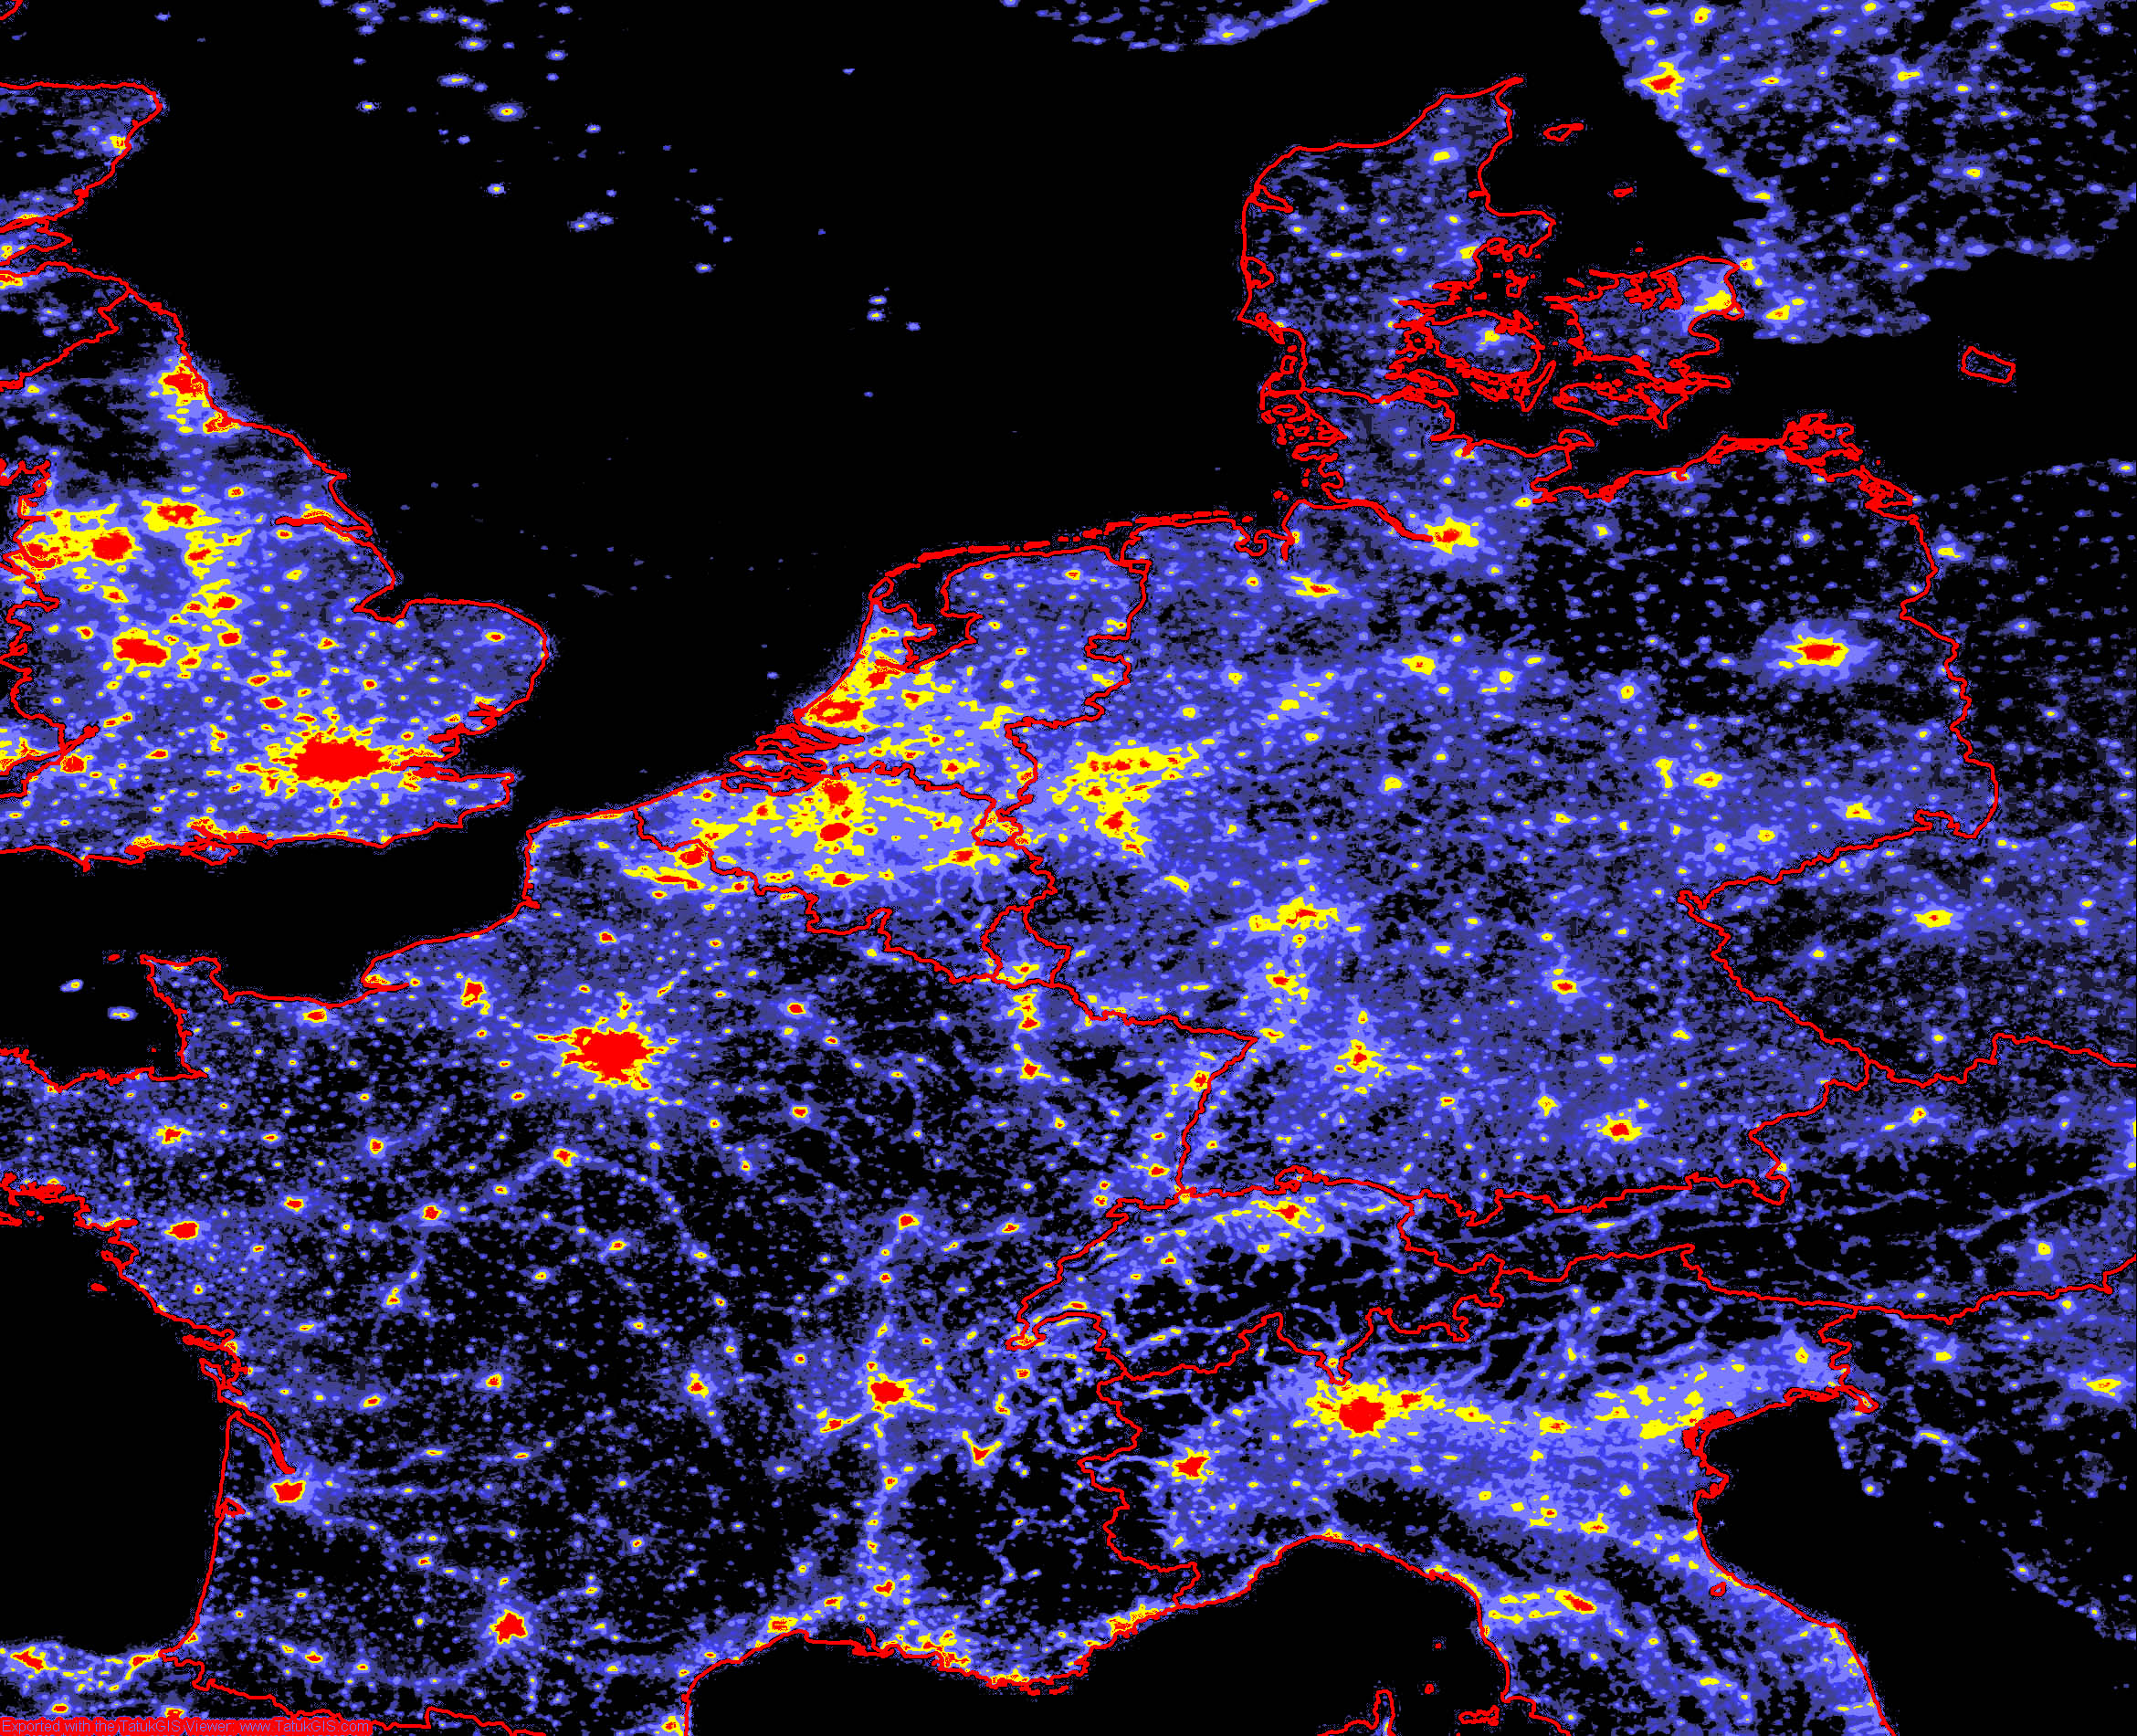
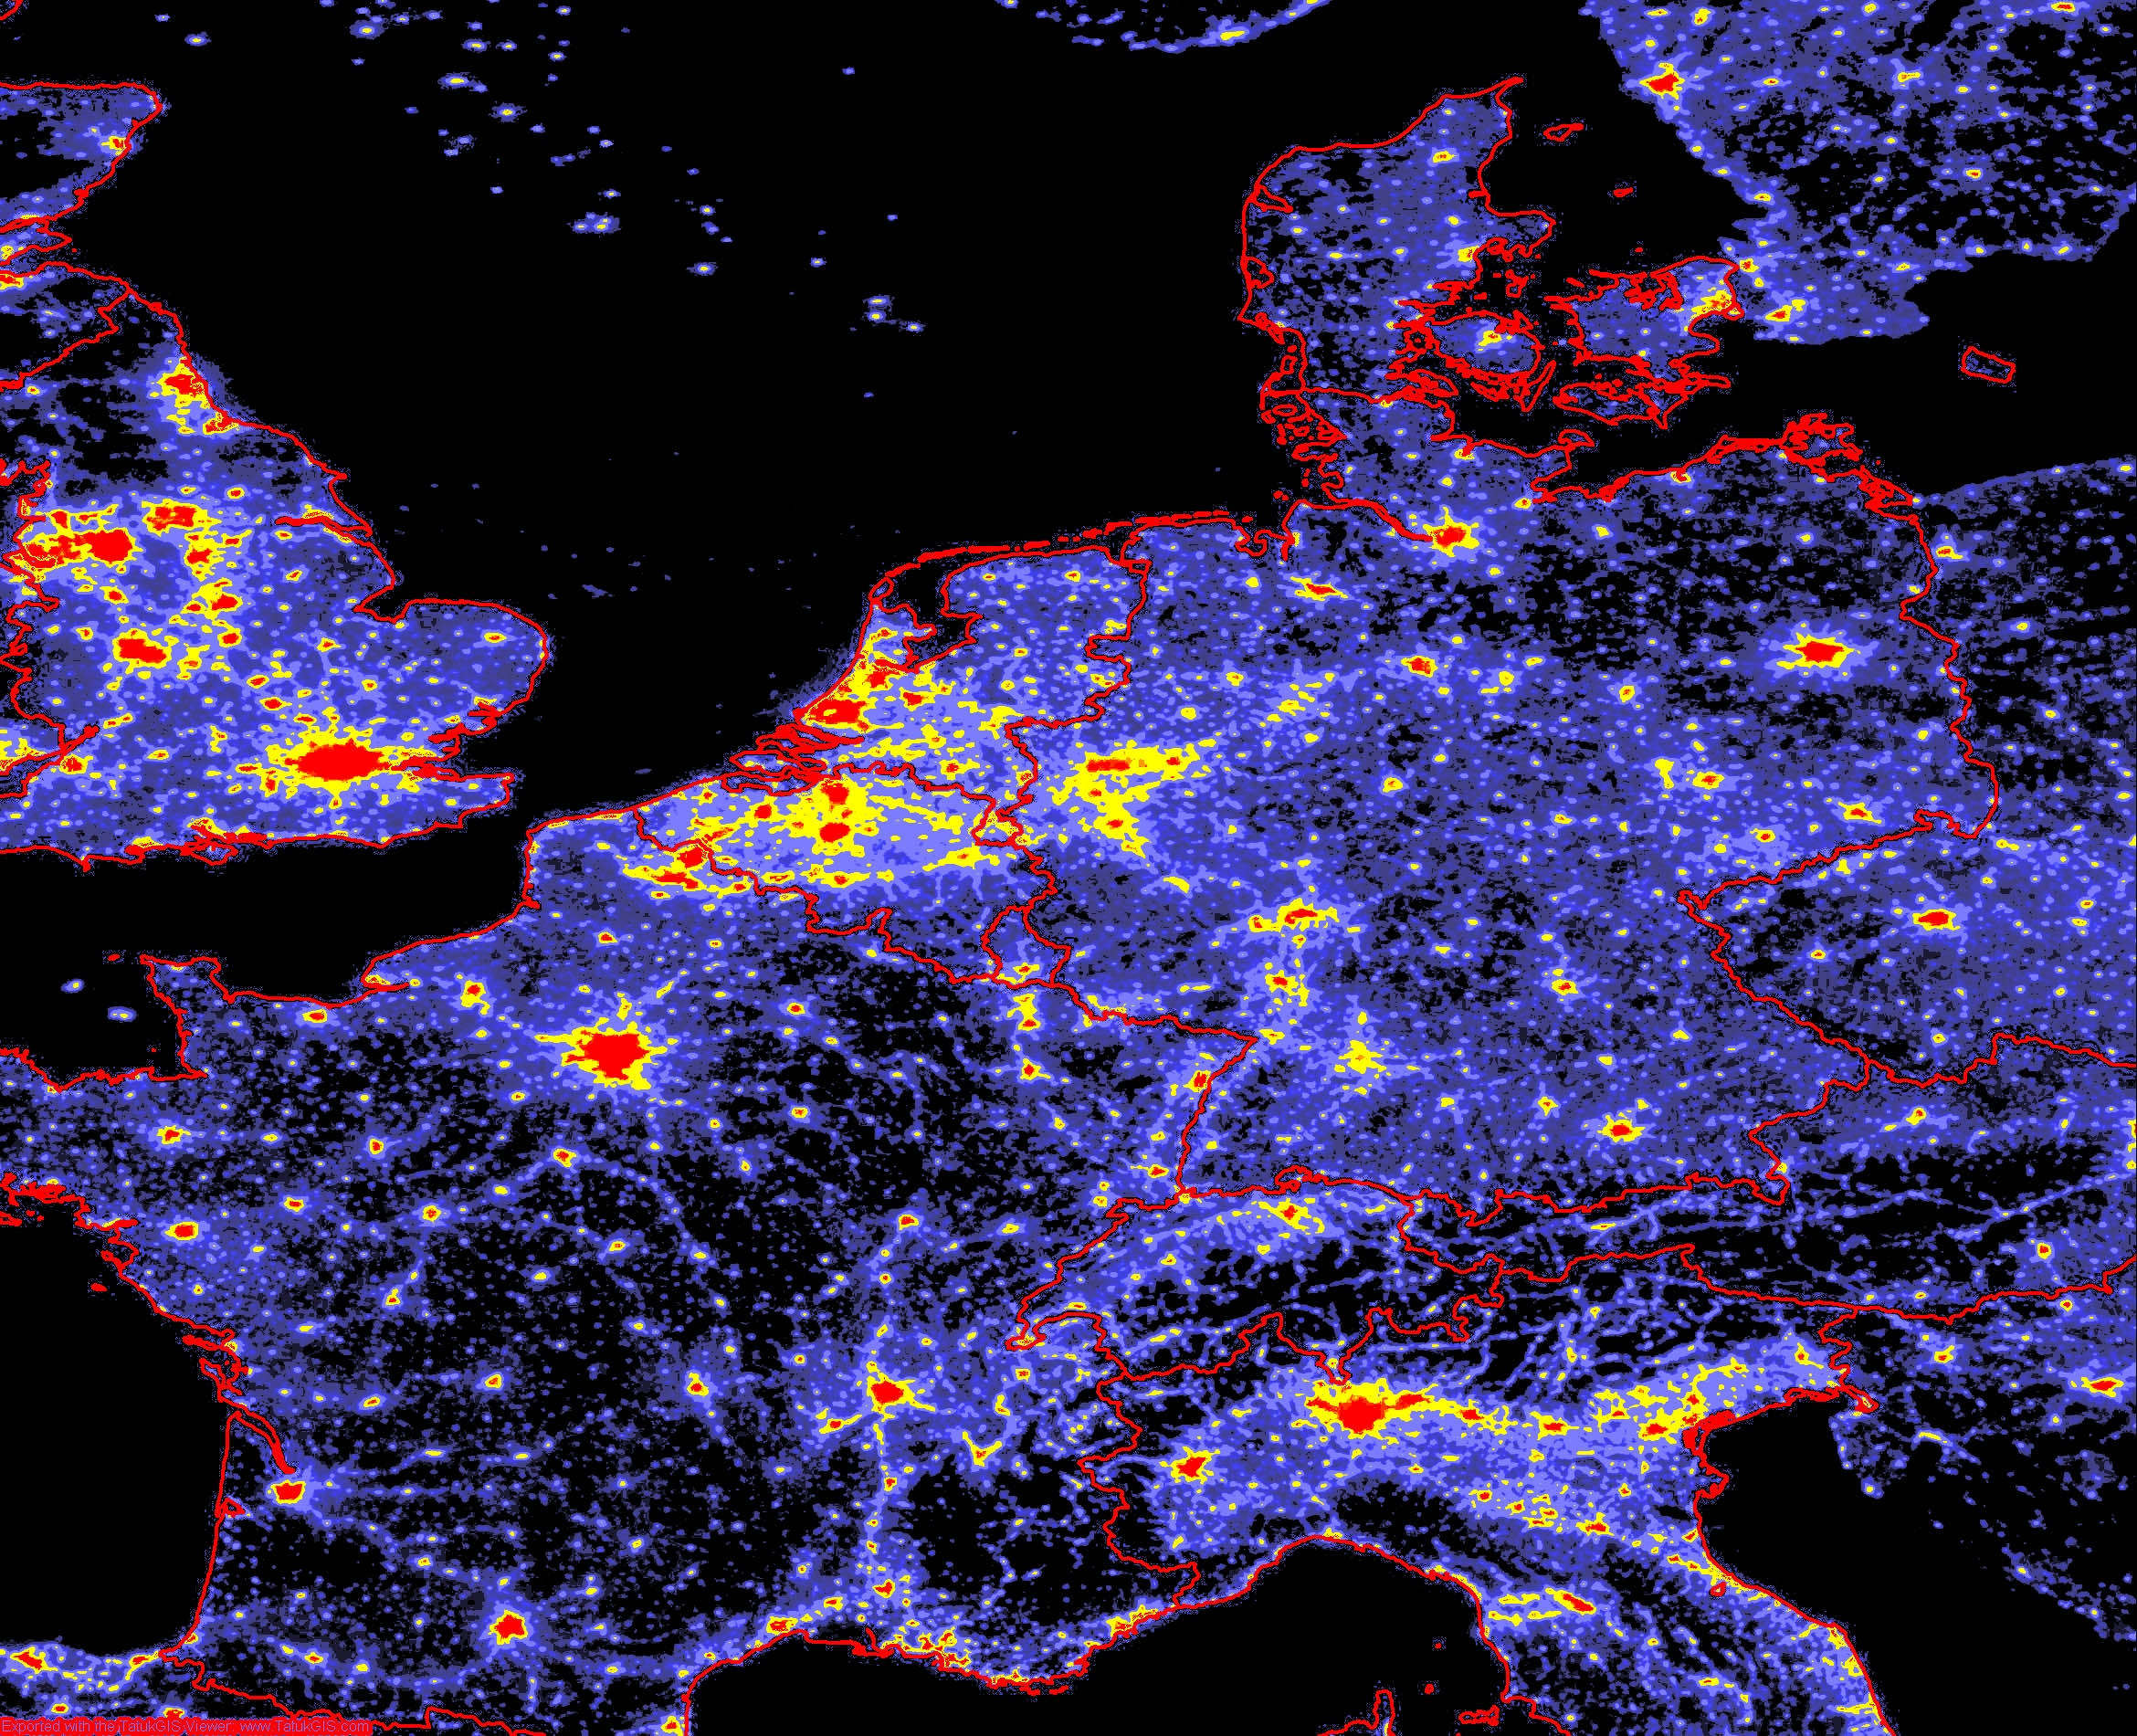
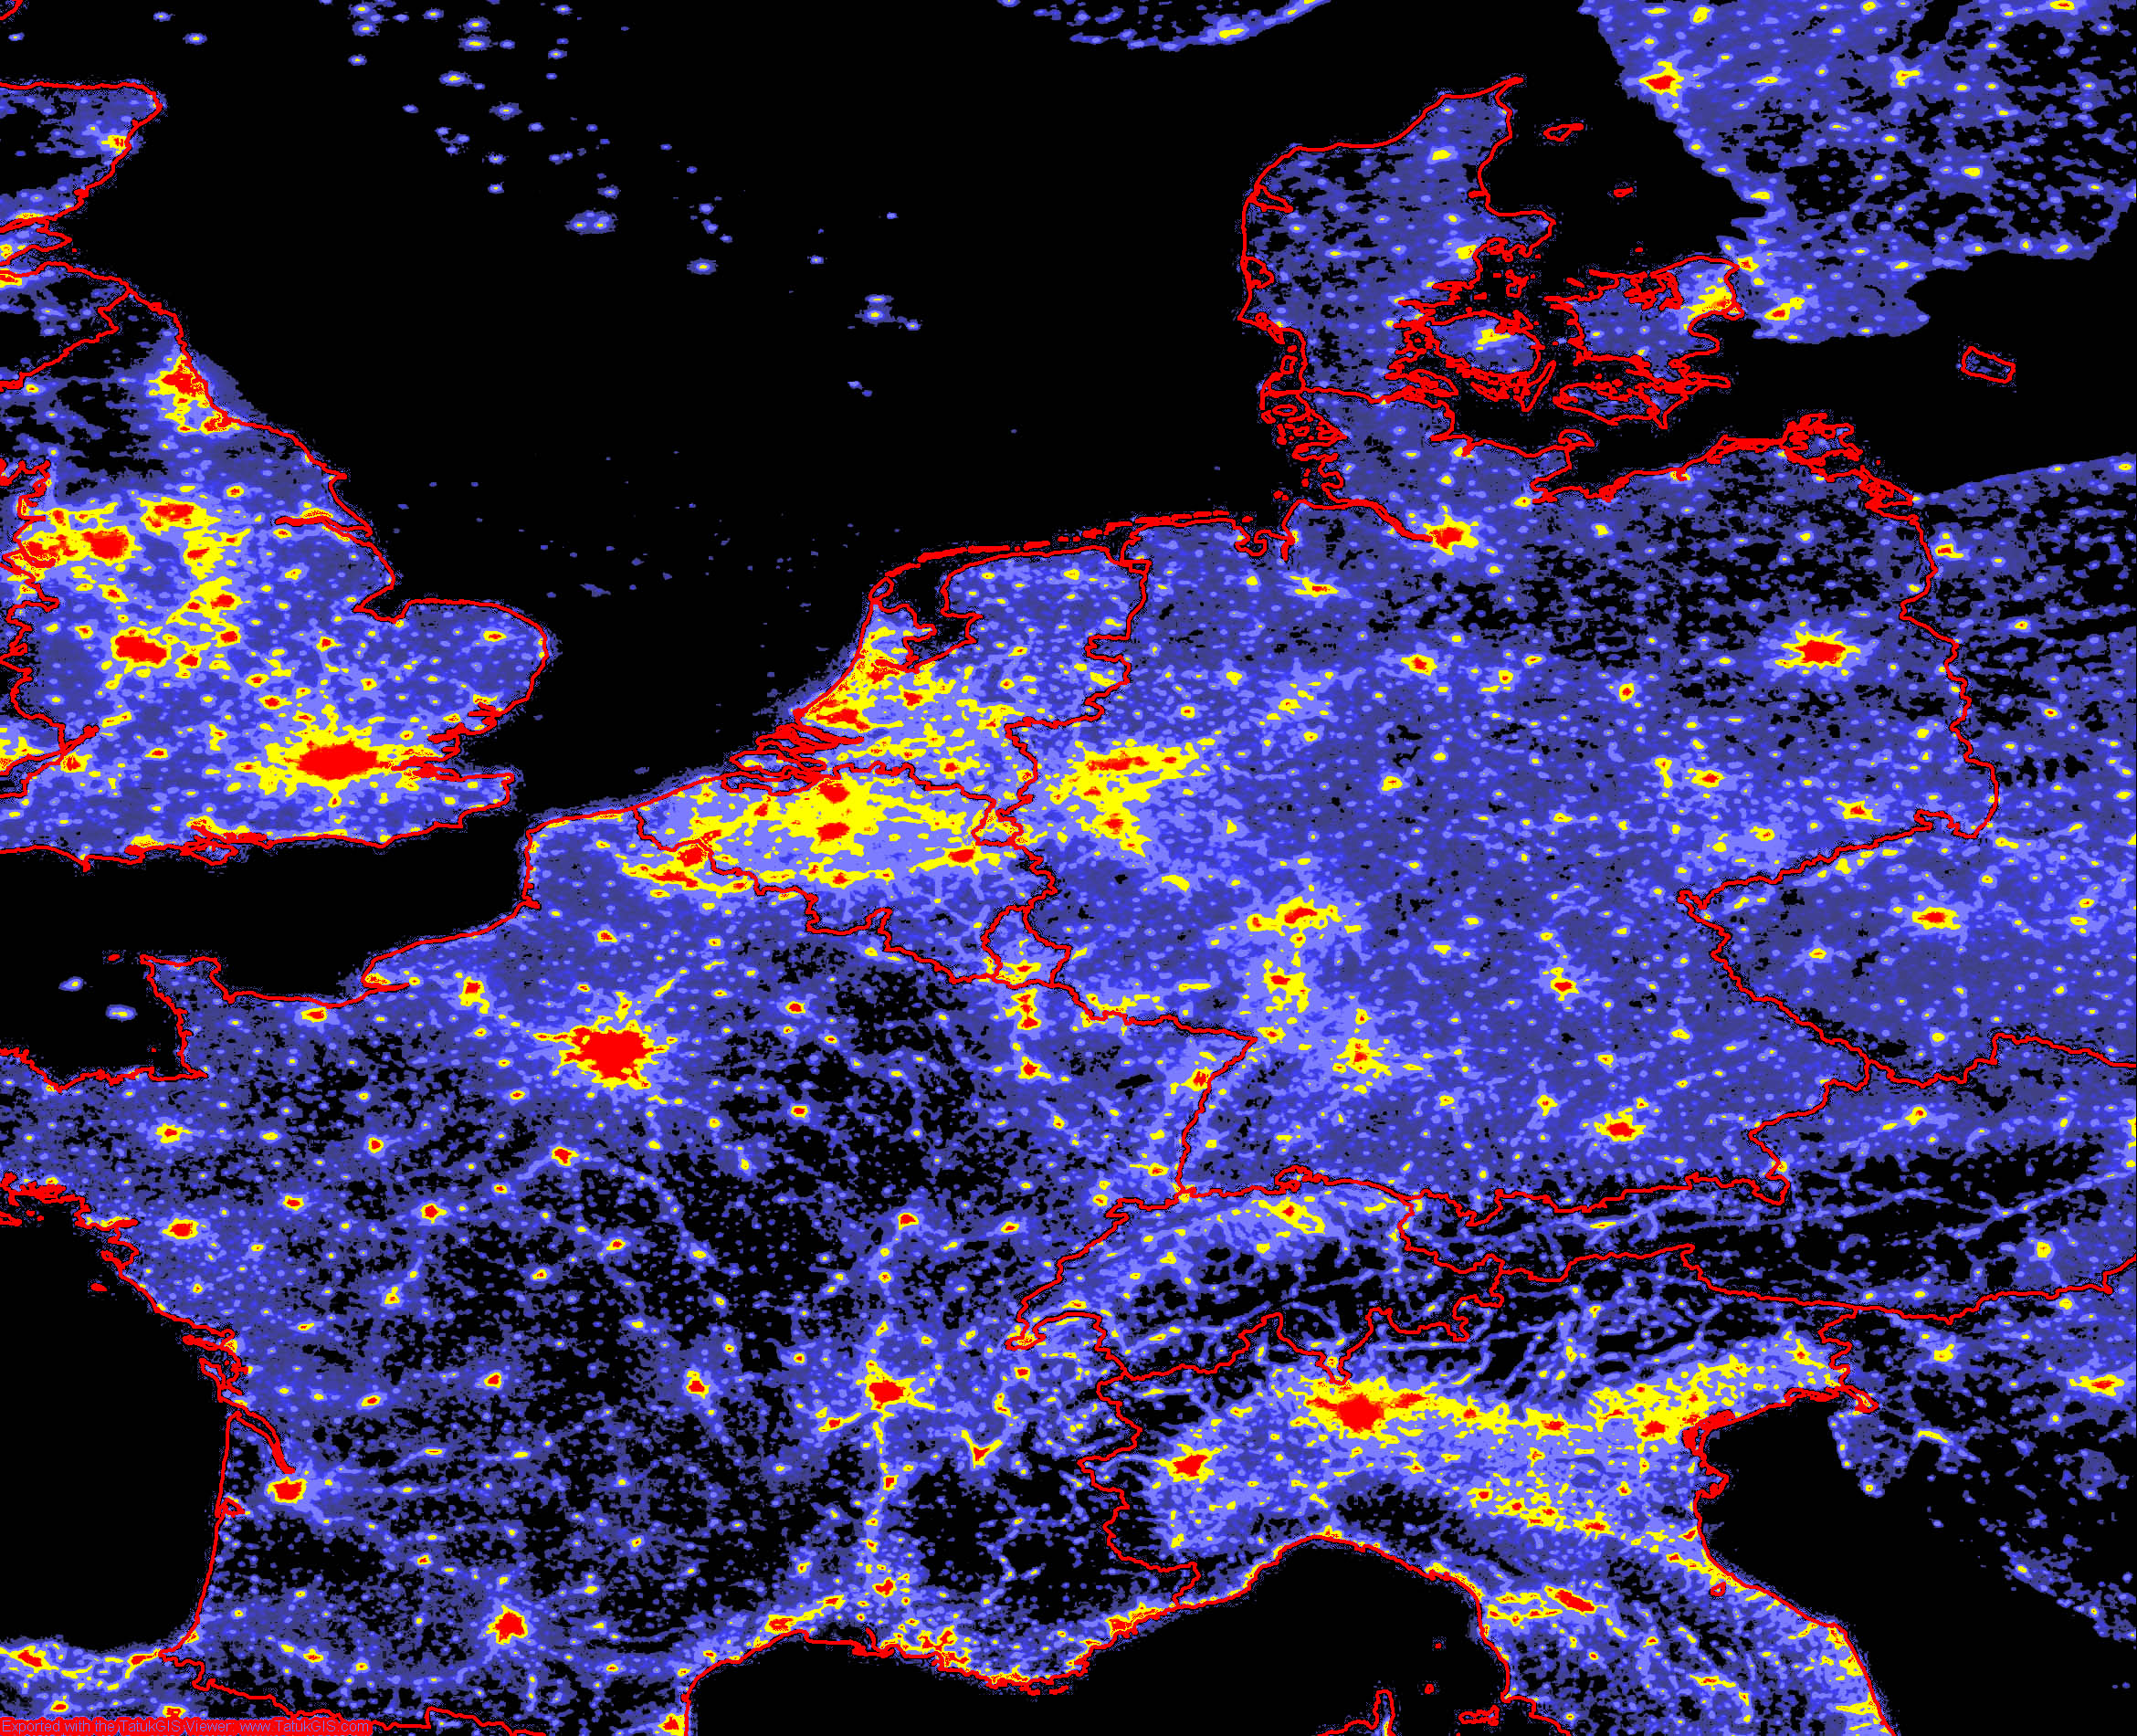
The american satellites of DMSP (Defense Meteorological Satellite Program) scan the lights of the Earth at night.
Actual maps of low resolution can be found under: spidr.ngdc.noaa.gov/spidr/querydmsp.do
Such measurements were used to create the fascinating map with artificial light of the Earth.
In February 2010 the 4th version for the years 1992-2008 from different satellites was available. Unfortunately the sensitivity of the detectors of the different satellites but also during the different years varied. Therefore the data from 2008 seem to be fainter than those of 2004.
An intercalibration like done by Elvige et al. (› article) was not yet possible. Nevertheless changes, especially close to the cities, can be detected.
In 2011 the Suomi National Polar-orbiting Partnership-Satellite was launched with the new VIIRS radiometer which delivers high resolution and dynamic night pictures of the Earth.
Satellite data courtesy of NASA Earth Observatory/NOAA NGDC
© A.Hänel
© A.Hänel
© A.Hänel
© A.Hänel
© A.Hänel
© A.Hänel

© A.Hänel
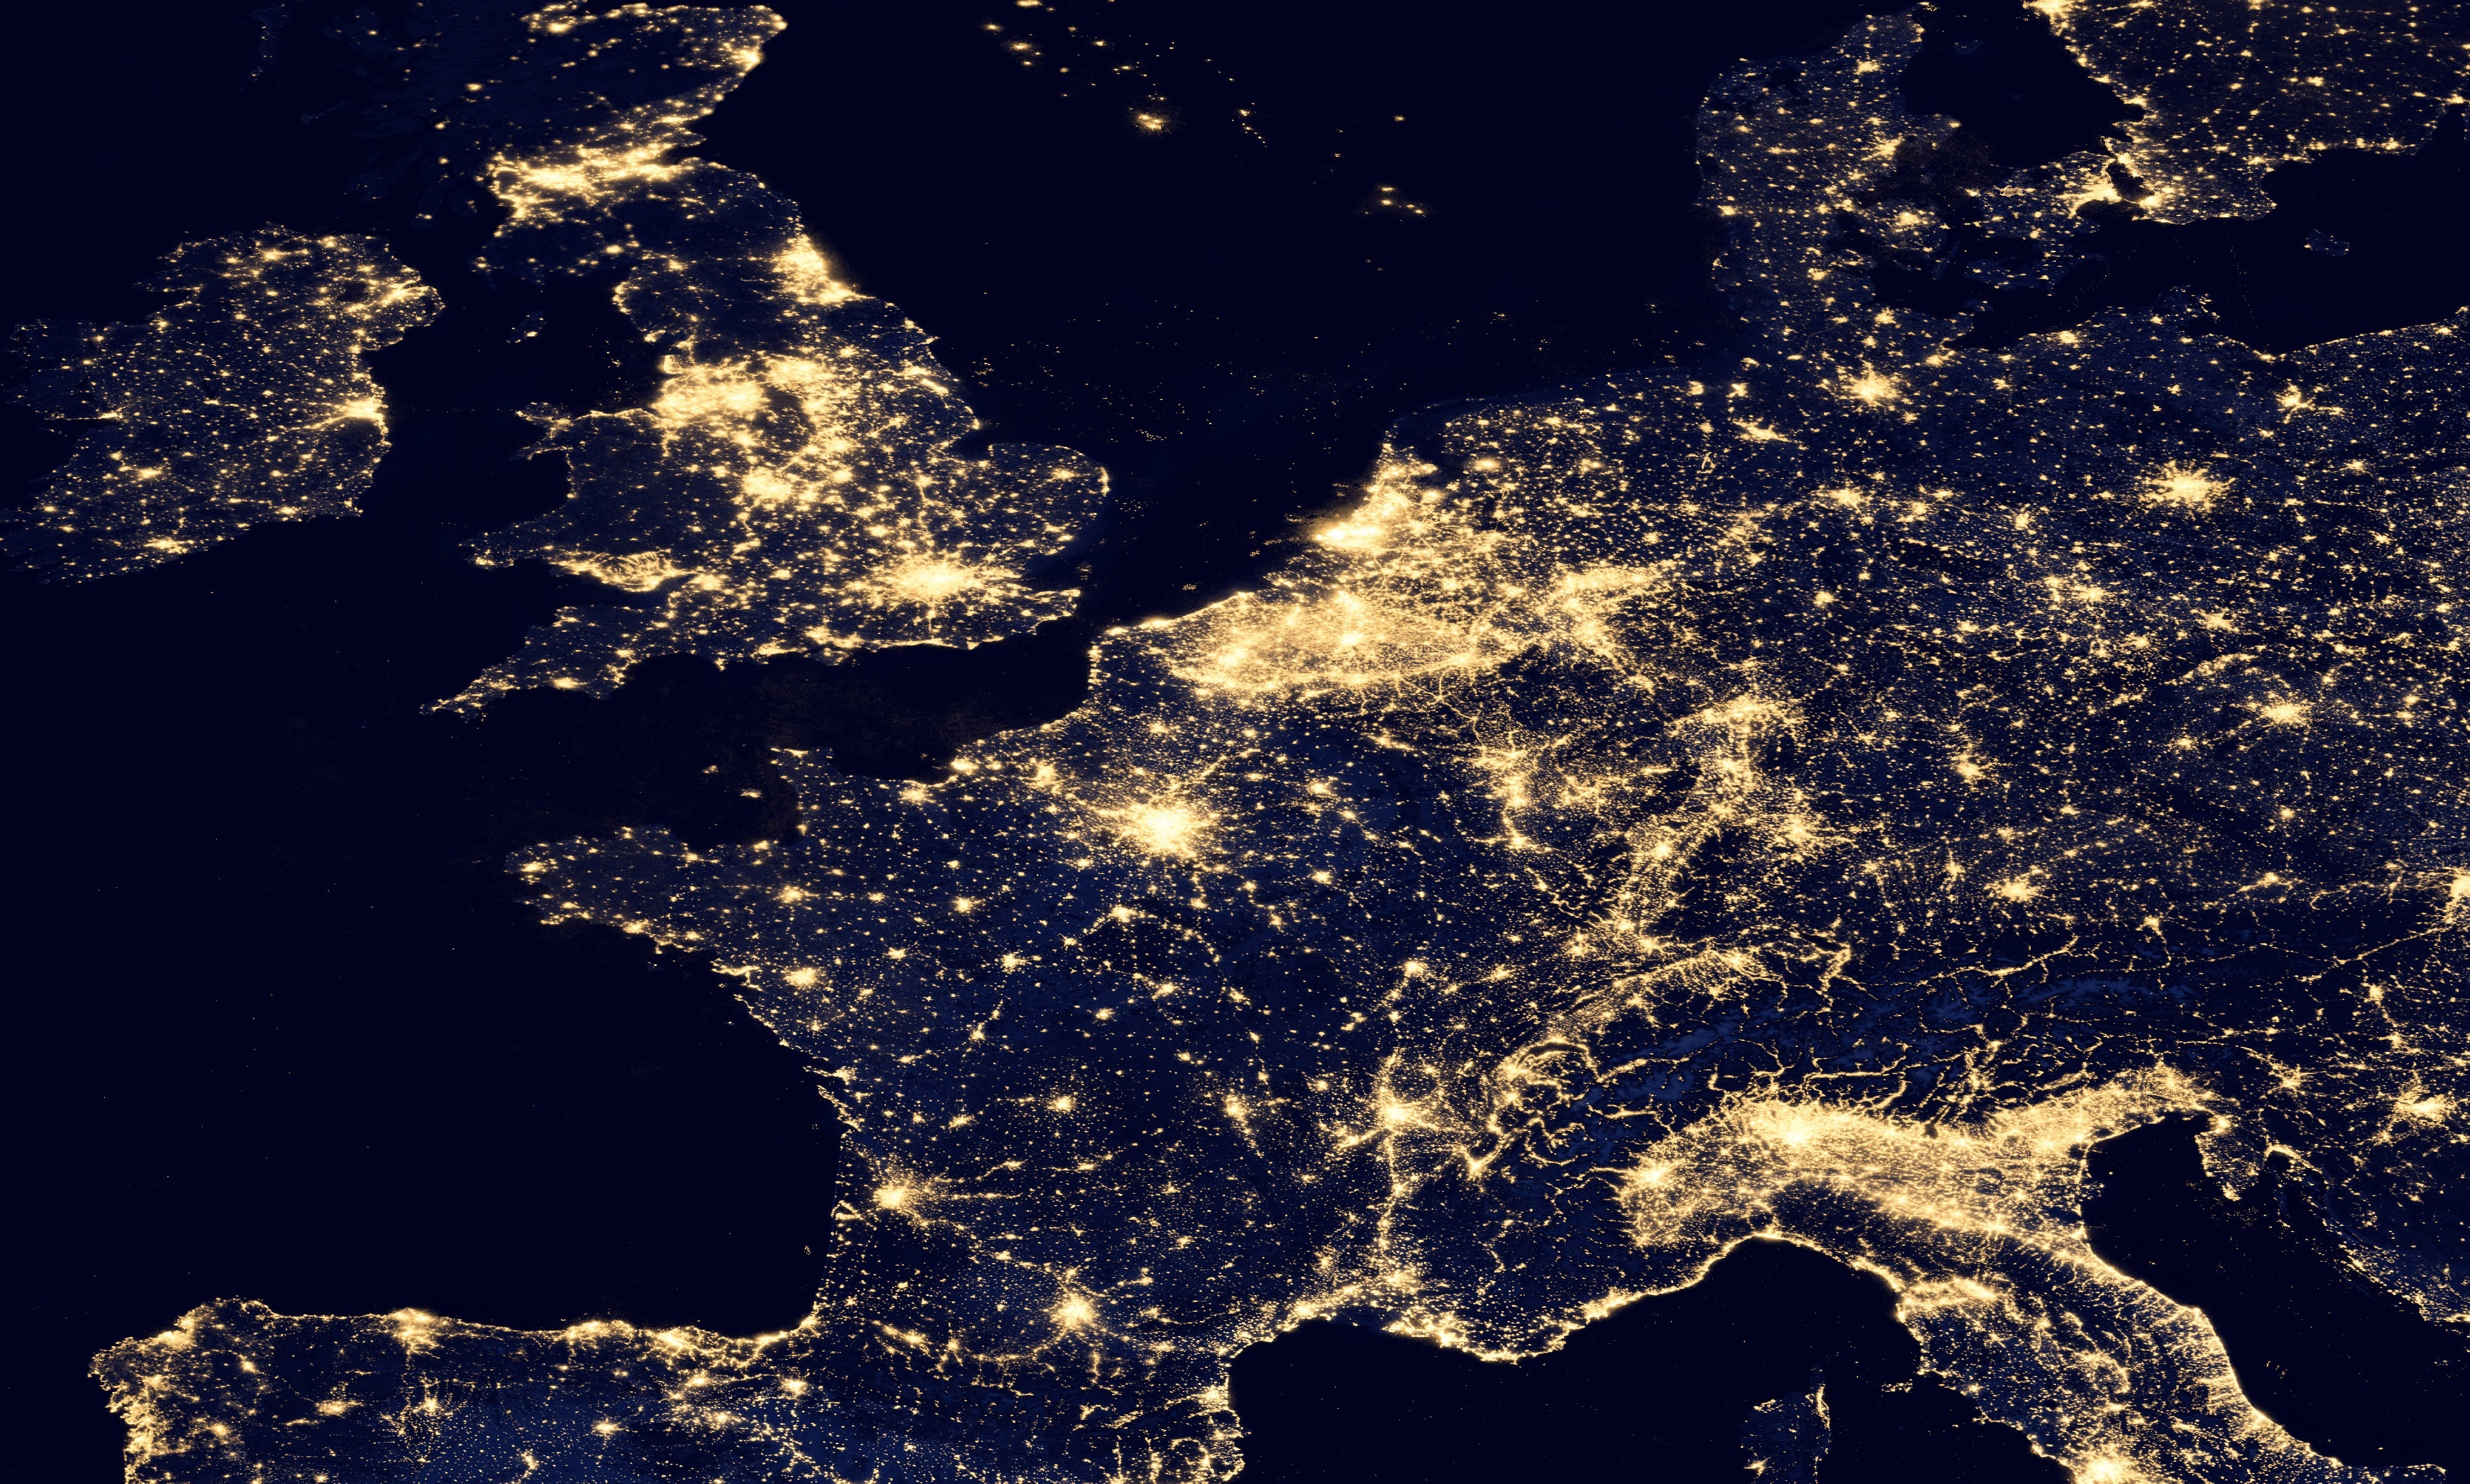
VIIRS-image of Central Europe
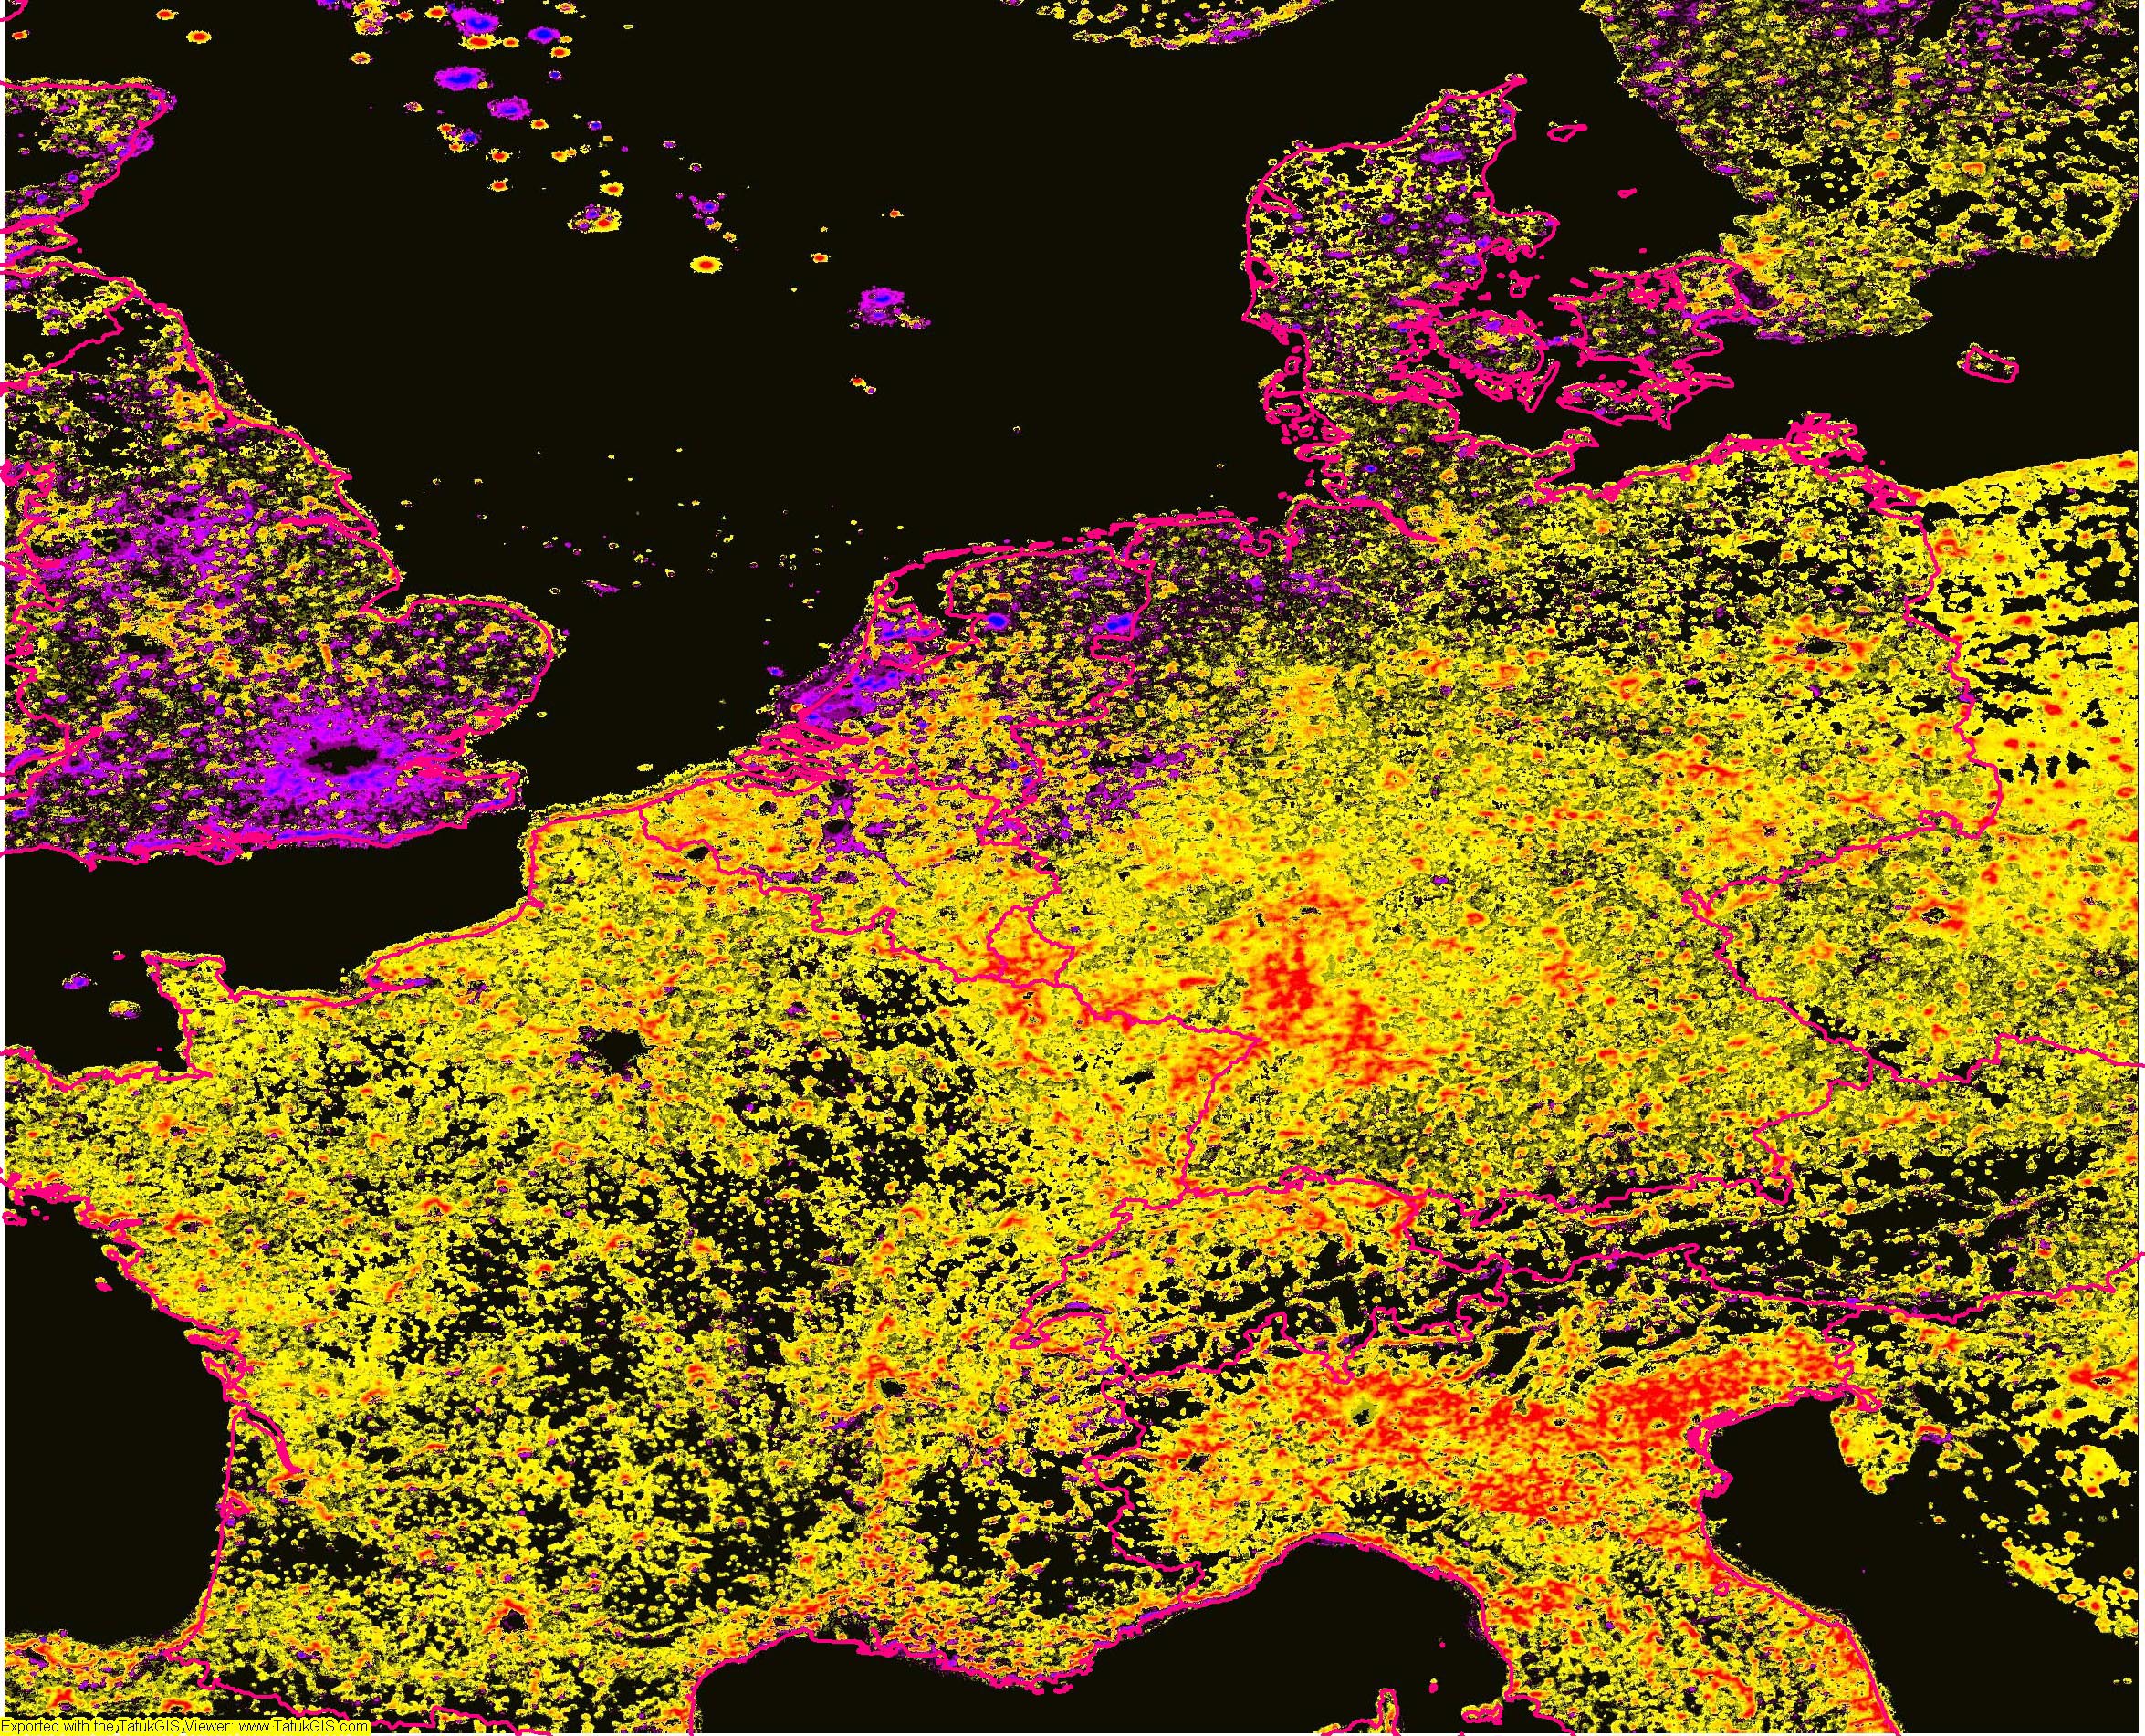
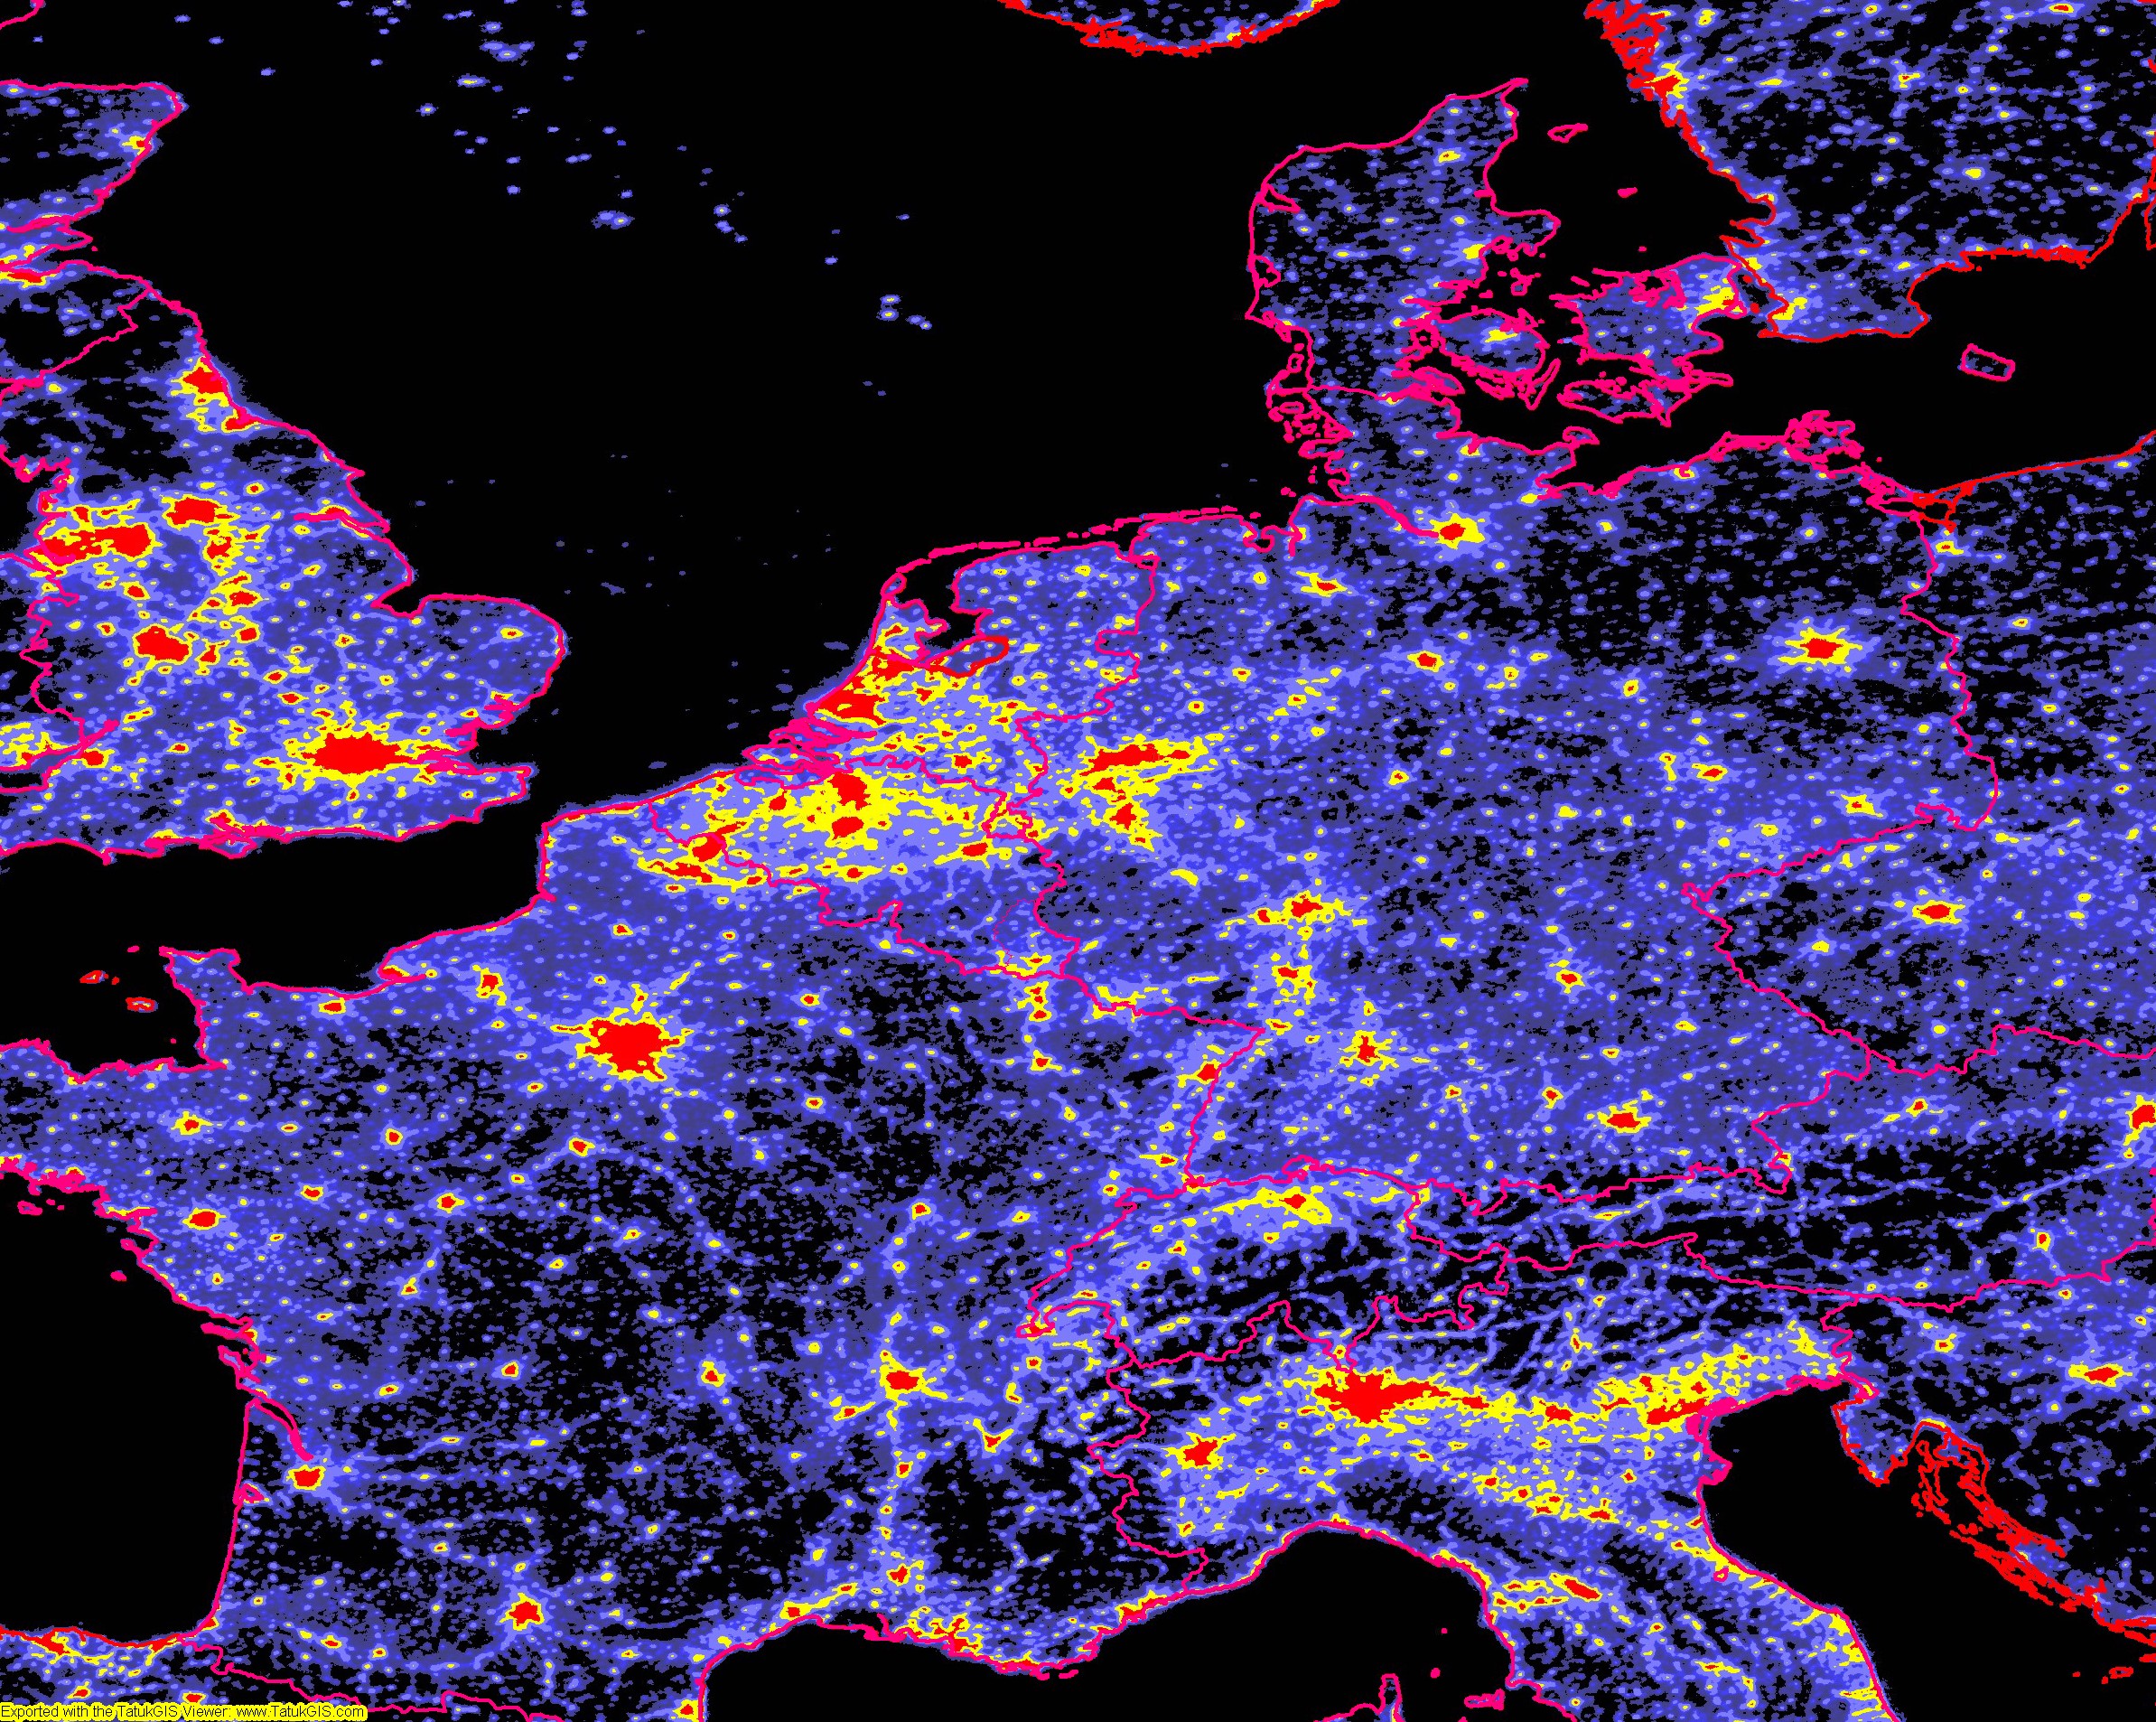
This map shows the difference between 2002 and 1993:
Yellow means an increase of upward light between 1993 and 2002,
Red an even higher increase.
Pink and blue shows a decrease.
The decrease in some regions of the Netherlands can be explained with the enormous areas of illuminated greenhouses, that are allowed to switched on only during certain time, in 1993 they were swithced on, but in 2002 off. Why the light around London has been decreased is unknown, it might be an instrumental effect.
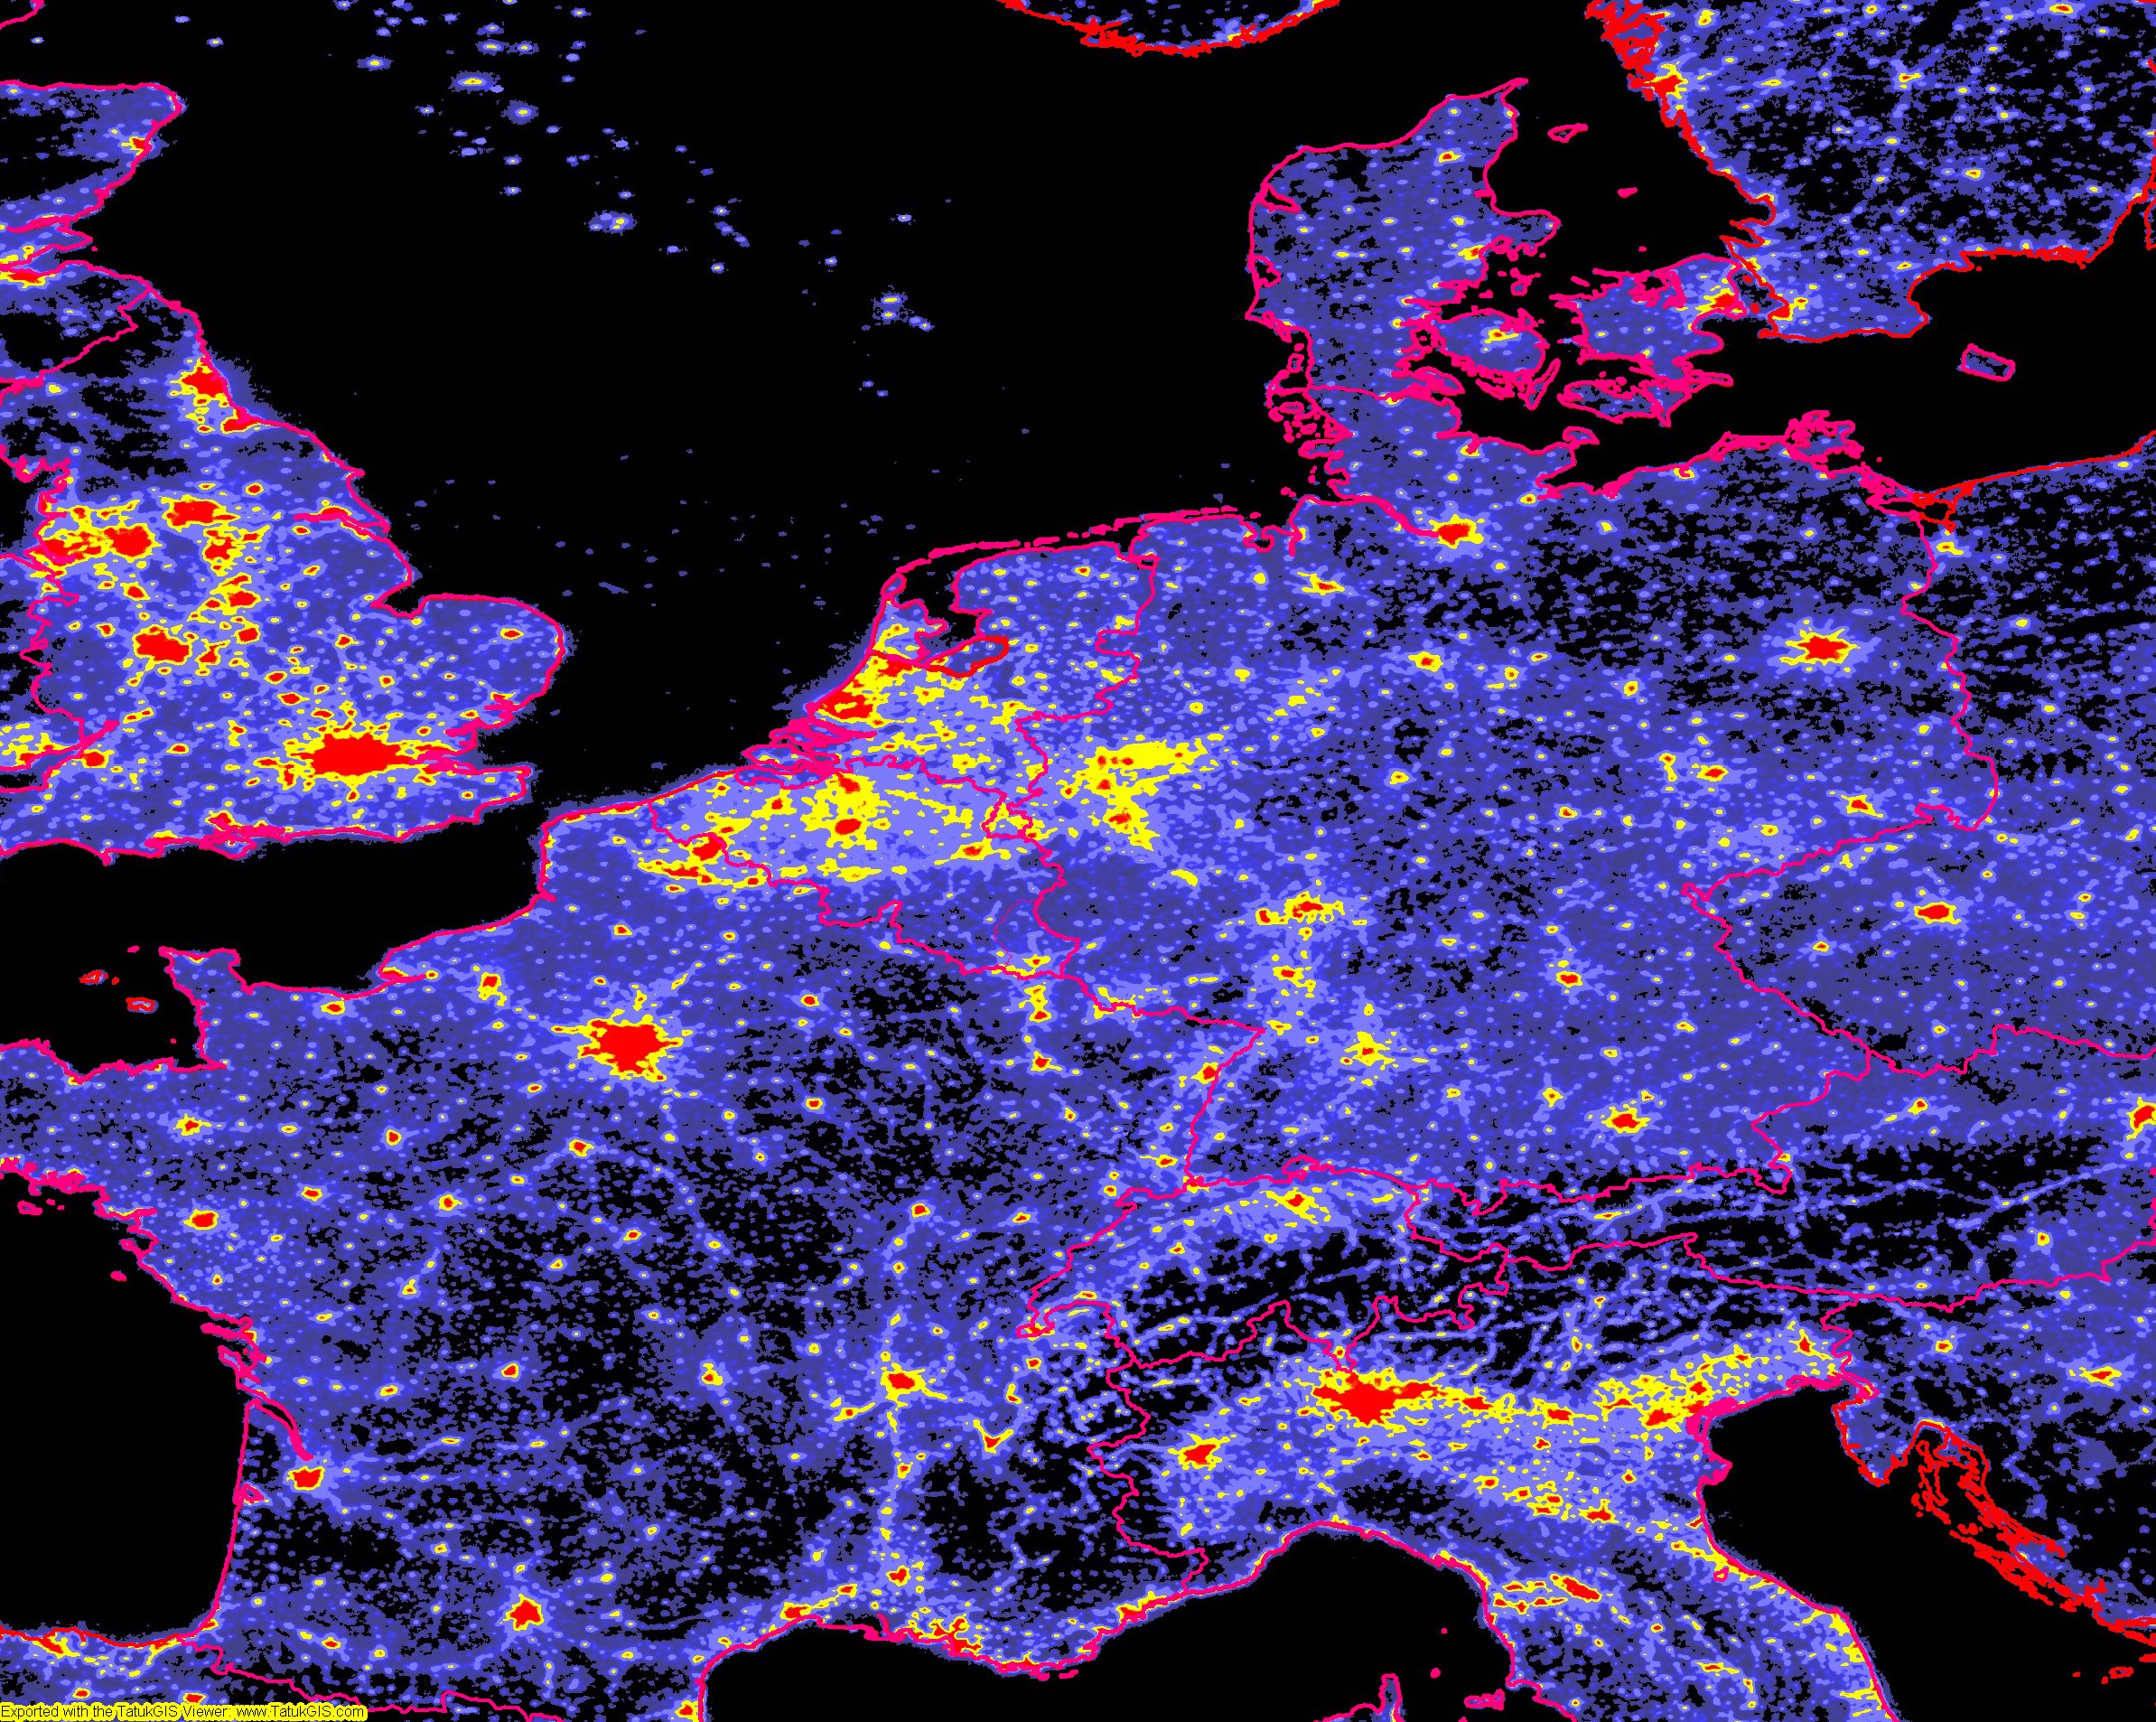
Pixel size is 0,5', corresponding to 0,6 km x 1 km in central Europe.
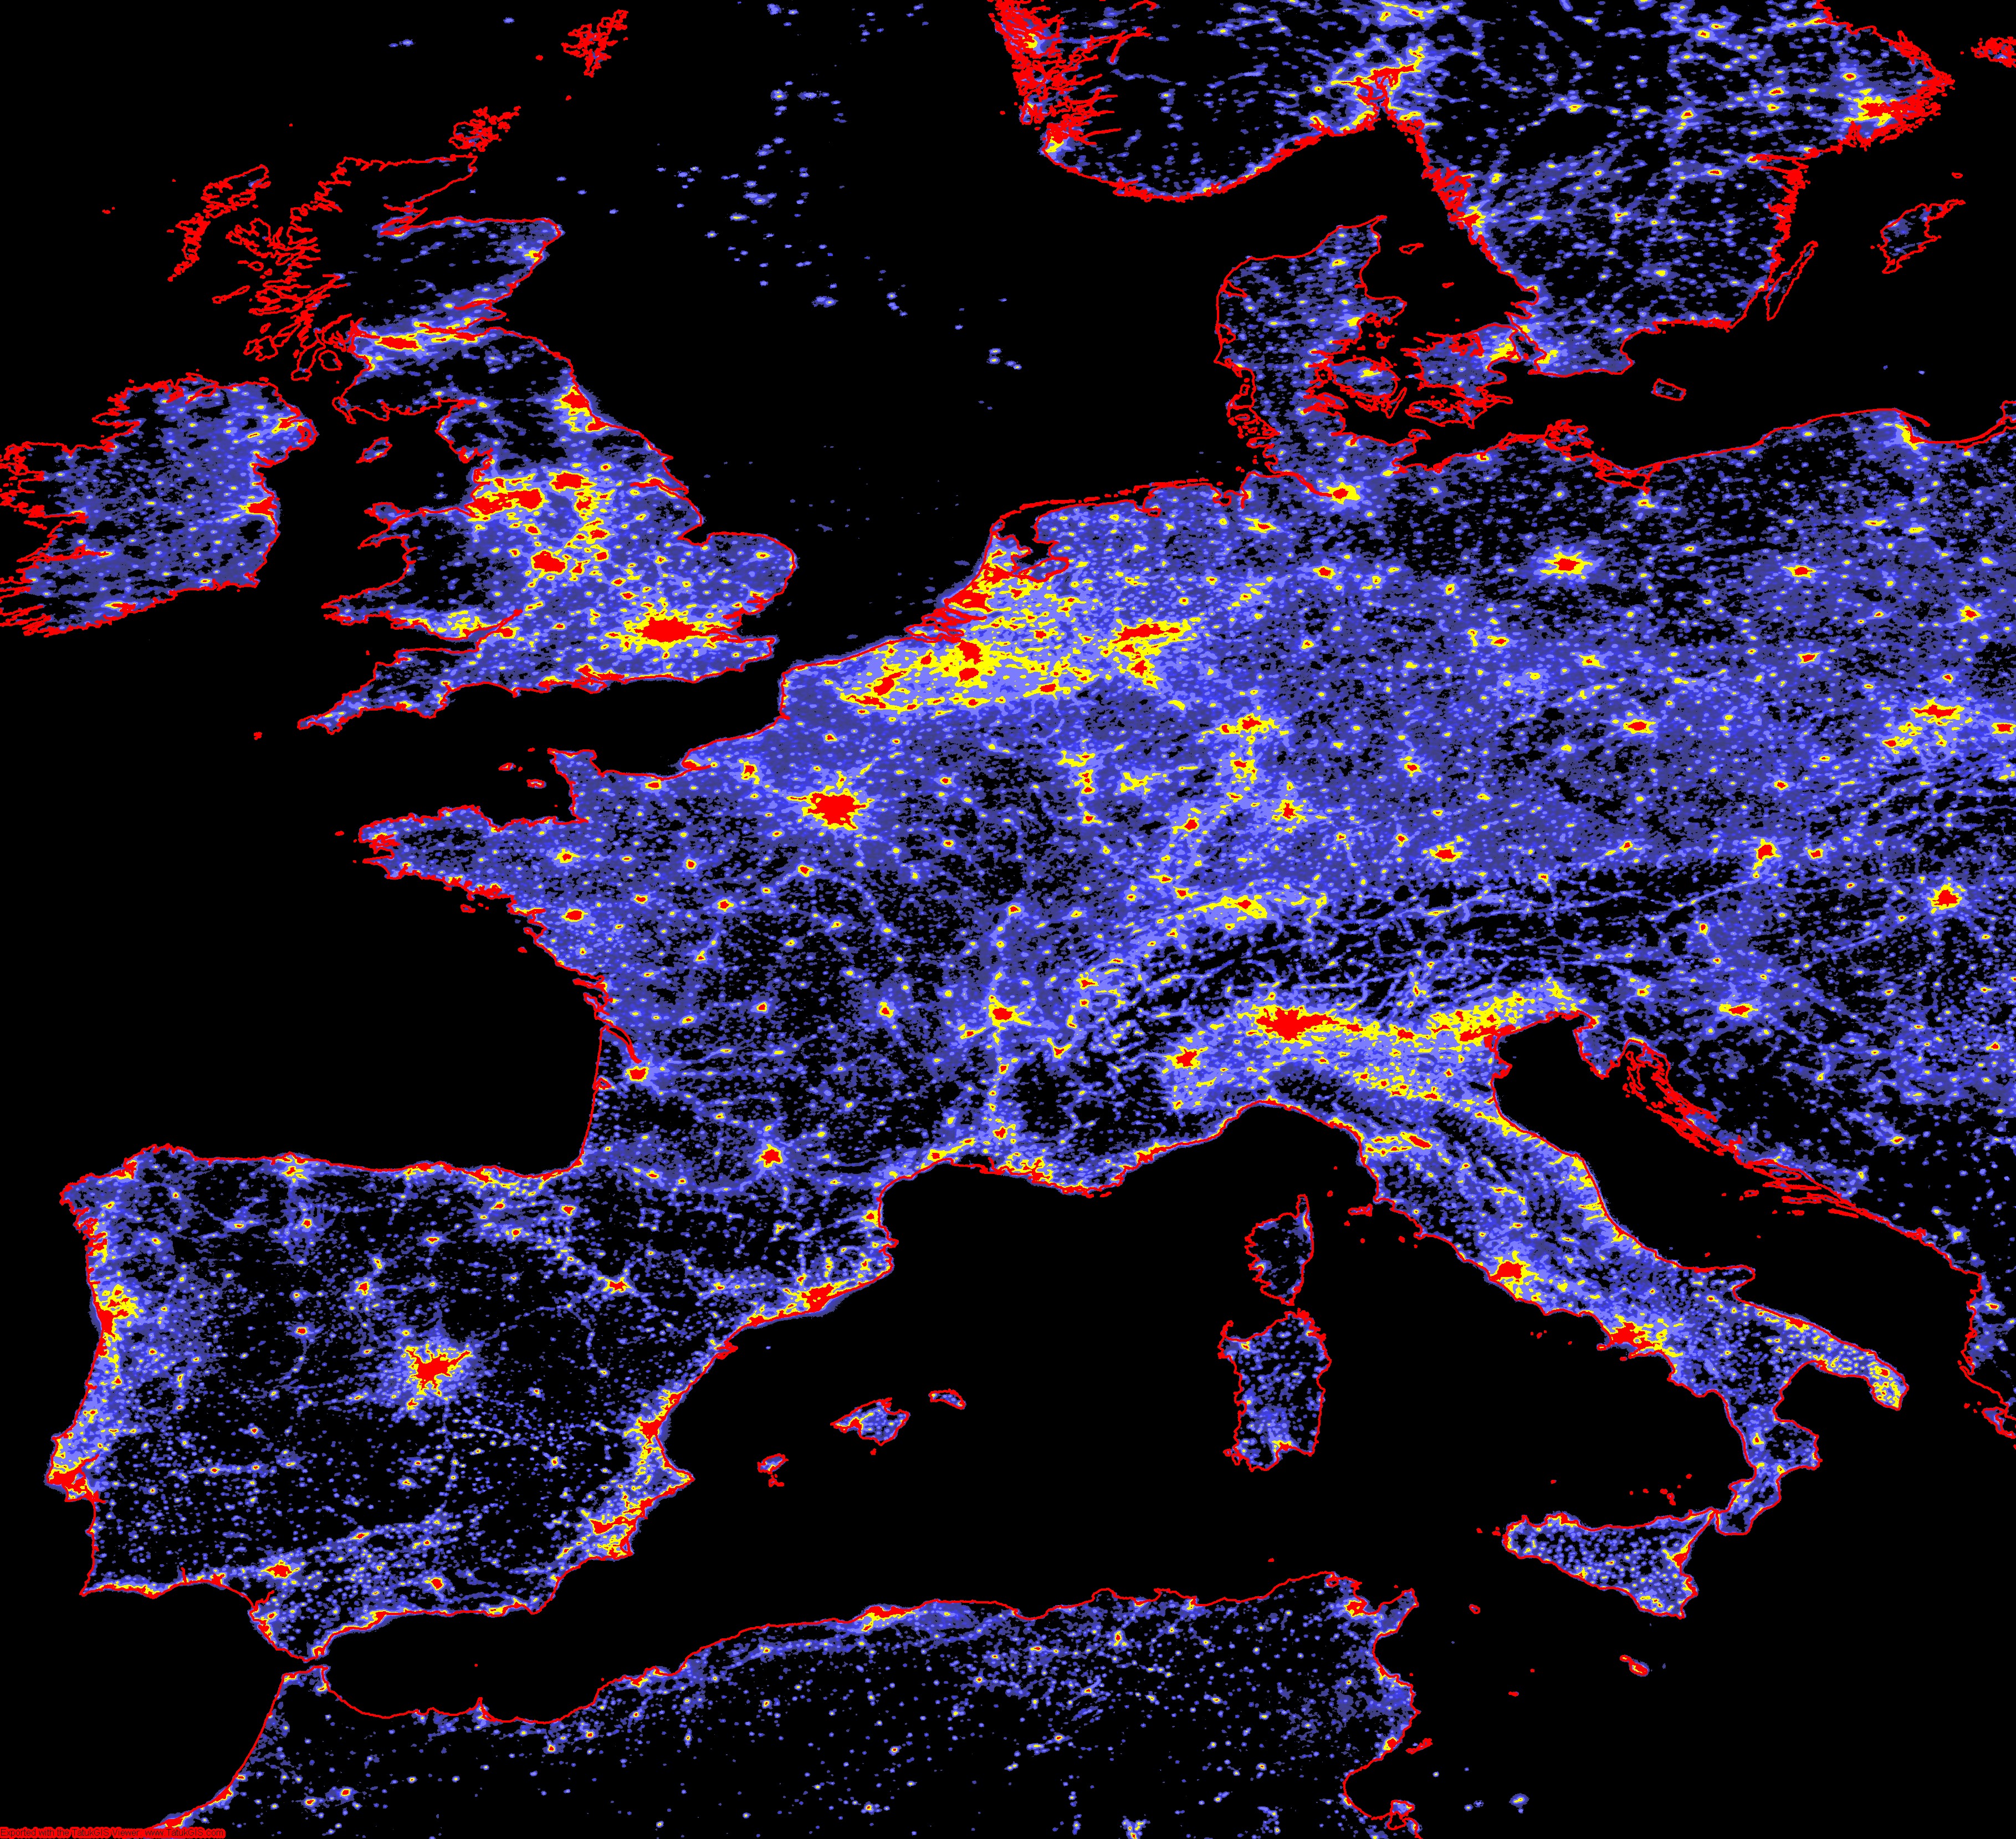
These maps show only the upward lights, that the satellites measure.
In fact, light is scattered in the atmosphere, which results in the fact that fainter stars are not visible. This has been modelled in the first world atlas of light pollution by Pierantonio Cinzano, calibrated in sky background brightness in mag/arcsec2.
The maps of Frederic Tapissier have a high resolution, but they are based on data for cities and commercial areas, to which he has attributed a certain brightness, and afterwards smeared to model light propagation in the atmosphere.
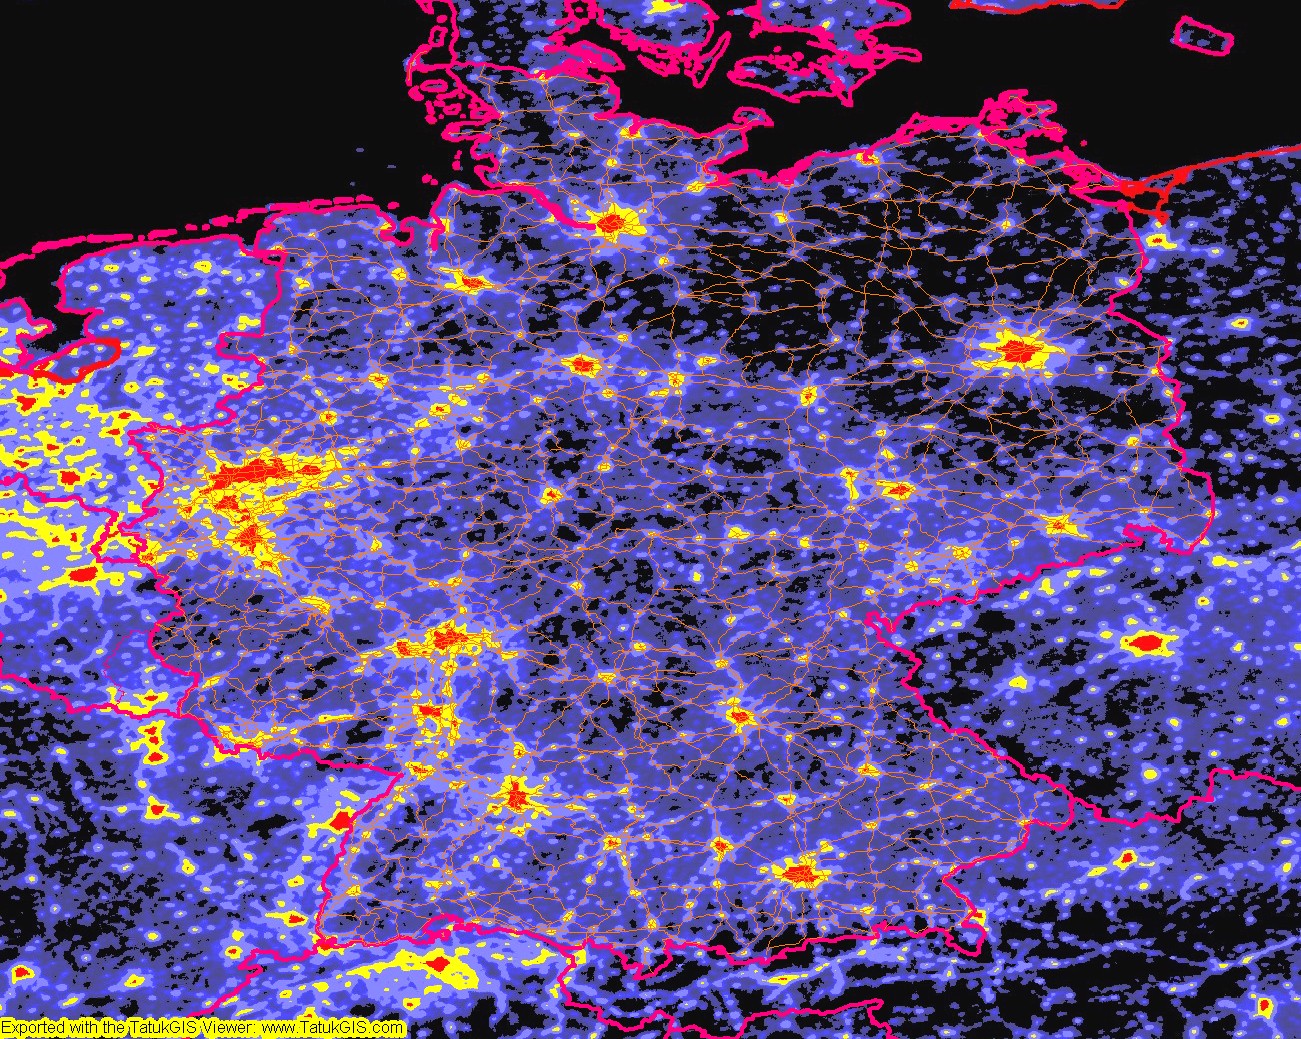
Streets have been overlayed on this map of germany for 2008 (right), to facilate orientation.
Users of moving map software (Fugawi, OziExplorer, Touratech) can use the georeferenced map and with a GPS the actual position can be shown.
![]() For GoogleEarth
For GoogleEarth
It is problematic to overlay streets , towns and their names for copyright reasons. But it is possible to overlay the maps onto the GoogleEarth maps, if GoogleEarth is installed on the PC:
By this way everybody in central Europe has the possibilty to compare the different data with his own observing experiences!
![]() Light pollution maps for the mobile
Light pollution maps for the mobile
The new version of GoogleEarth for Android smartphones and tablets displays also kmz oberlay maps. It is possible to display the kmz maps of light pollution but it takes a long time to load them. Therefore smaller maps have been prepared. The position can be displayed with the gps so it hepls to find dark observing places. These smaller maps are available at the moment:
You can't acces the files at the moment directly from GoogleEarth, you have to open them with a file manager (eg. ES File Explorer), then they are displayed in GoogleEarth.